
There is a mixed picture across the Core STEM workforce in 2016. Whilst it is positive to see an increase of 13,000 more women working in Core STEM occupations, the proportion of the workforce made up by women has decreased from 22% to 21% since 2015.
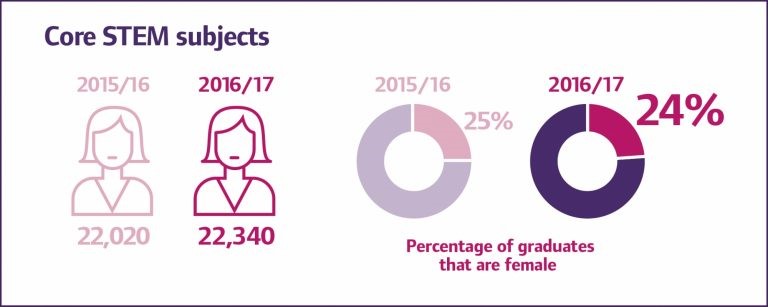
This demonstrates that some progress is being made, but as the STEM sectors continue to grow, the rate at which women are taking up jobs does not compare to that of men.
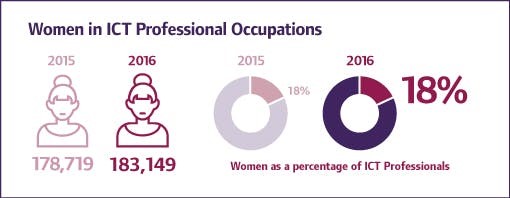
There have been some areas with a positive change such as the ICT Professionals category which has grown by 3% since 2015. The growth in the number of women has managed to keep pace in this category with 4,400 more women entering this field since last year, keeping the proportion of ICT professionals who are women at 18%.
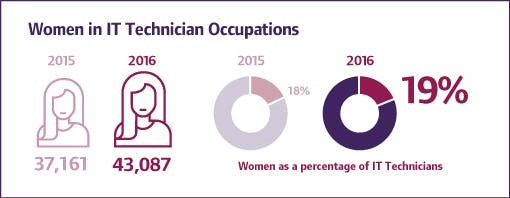
Similarly, within the ICT Technician’s category, women have increased in number by over 6,000 since 2015, an increase of 16%, in a category that only grew by 14% overall. Women now represent 19% of this category, up from 18% last year.
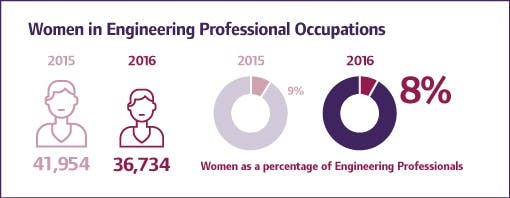
However, not all areas show such positive increases, for example the Engineering Professionals occupational category, which has grown by 2% since 2015, women now represent only 8% of this group, down from 9% last year. This is due to the loss of over 5,000 women. This is despite large increases in both the numbers of female electronics and mechanical engineers; the number of women in these roles has increase by 55% and 124% respectively.
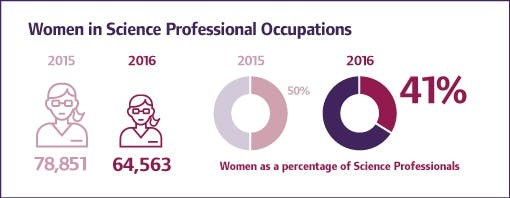
In the Science Professionals category, since 2015 there has been an overall decrease of -0.25% but a staggering 18% loss in women (representing over 14,000 individuals). They have dropped from representing 50% of this category to 41% since last year.
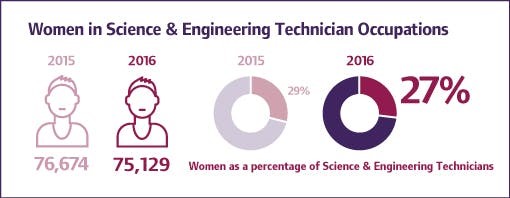
The number of women in the Science and Engineering technician category has fallen by just over 1,500 (a decrease of 2%), women now represent only 27% of all Science and Engineering technicians. This is despite the category growing by 5% overall, and increases in certain areas such as Electrical and Electronics technicians where there are now 73% more women and Building and Civil Engineering technicians which saw 3,700 women join the profession since 2015.
There is a much more positive picture in the SET management category in which there are now 17,000 more women, representing an increase of 23%; the category grew by 5% overall. The proportion of SET managers who are women is now 14%, up from 12% last year. WISE are not able to track progression within roles but it is hoped that some of the losses in the Engineering and Science professionals categories are due to promotion into SET management.
As shown above, the view across the Core STEM landscape is very varied, even within occupational categories. Even with the encouraging increases in ICT professionals, ICT technicians and SET managers; women represent well below half of all individuals and in other occupational categories, drops in the number of women are taking us even further away from gender parity.
There is plenty of work still to do, not just at the level of the labour force but at the educational end of the pipeline too. Ultimately female representation in STEM occupations is a composite of demand and supply. The supply of qualified STEM women emerging from further education – either university or apprenticeships – is not trending upwards and until it does, we will not see the breakthrough that will change the face of industry.
In 2016, WISE aligned its definition of science, technology and engineering (STEM) categories with those used by other leading organisations publishing statistics about the UK STEM workforce; including Engineering UK, BCS and the UK Commission on Employment and Skills (UKCES).
Most organisations, including WISE, use the Standard Occupational Classification (SOC) data produced by the Office of National Statistics but there have been differences in how this baseline data is grouped in to STEM and other categories. For 2016 and beyond, we have followed UKCES in separating out health and health associate professionals as a “Medical STEM” group and we have adopted the Engineering UK guidance on what constitutes ‘’Engineering Skilled Trades”. Our third category for reporting is “Core STEM”, comprising science, engineering and ICT professionals; science, engineering and ICT technicians and related occupations.
Core STEM and Skilled Trades categories are of most interest to WISE from a gender balance perspective as Medical STEM occupations currently comprise 73% women. Following UKCES guidance, more occupations are now included in the Core STEM category than were included in the statistics published by WISE in previous years – including for example business research professionals, environment professionals, airline pilots and flight engineers, health and safety officers. Using our new definition of STEM, women make up 21.1% of the Core STEM workforce in the UK.
In order to maintain data integrity and show trends, we have re-calculated data for 2014 and 2015 on the same basis as we have used for 2016. In 2015 the equivalent figure was 22.1%, and 19.7% in 2014. The full list of Standard Occupational Codes WISE has used can be downloaded here.
We believe that the changes we are making will help WISE focus more clearly on the impact we, and our peers, are having in the gender parity in the STEM workforce.