
WISE has found concerning Gender Pay Gap (GPG) differentials between women over 40 and their younger colleagues; women in England compared with workers in Scotland and Northern Ireland; and higher earning women compared with their male peers. The following report provides more detail on the GPG ahead of our wider analysis to be released in April.
Introduction
The gender pay gap (GPG), the difference between male and female earnings, is a key metric for organisations looking to create parity for female employees in the workforce since it is a strong indication of the level of gender inequality. As such, WISE encourages all member organisations to collect data around their GPG even if they don’t actually have to publish this by law.
Calculating the Gender pay gap
The Gender pay gap (GPG) is calculated as the difference between average hourly earnings of men and women as a proportion of average hourly earnings of men (excluding overtime). For example, a 2% GPG denotes that women earn 2% less, on average, than men. Conversely, a -2% GPG denotes that women earn 2% more, on average, than men.
We use the Median for gender pay gap data – which is the value below which 50% of jobs fall. We use the median (as opposed to the mean) as it is less affected by a relatively small number of very high earners since this can skew the distribution of earnings.
The Gender pay gap in the UK
The gender pay gap in the UK has declined over time – in 1997, it was 27.5%, by 2022, this had dropped to 14.9%. The fall demonstrates that we are making good progress in pay equality – however, as the following findings show there is still a long way to go.
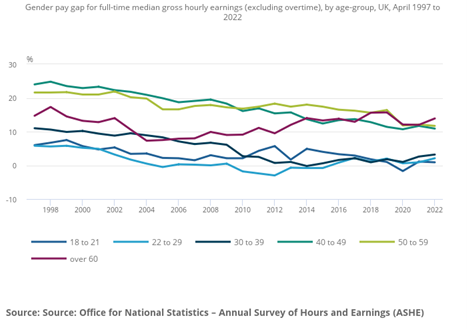
- There remains a large difference in the gender pay gap between employees aged over 40 years and those aged below 40 years as Figure 1 demonstrates.
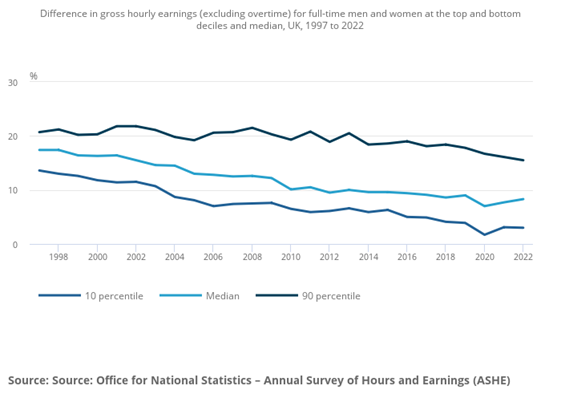
- As Figure 2 shows, higher earners experience a much larger difference in hourly pay between the sexes than lower earners.
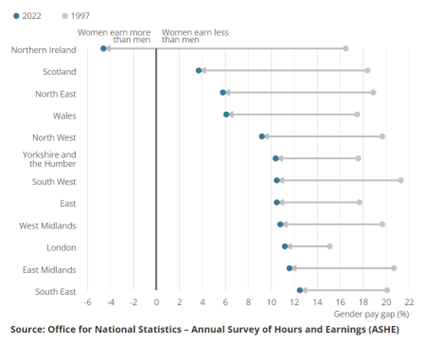
- Sadly, the gender pay gap is higher in every English region than in Scotland and Northern Ireland as Figure 3 shows.
Breakdown of GPG Data for STEM SOC Code Roles
The gender pay gap data can be broken down into individual STEM roles using SOC Codes. As of April 2022, some of those with the highest gender pay gaps include:
- Waste disposal and environmental services managers
- Production managers and directors in construction
- IT project managers
- Chartered architectural technologists, planning officers and consultants
As of April 2022, some of those with negative scoring pay gaps include:
- Chartered surveyors
- IT quality and testing professionals
- Conservation professionals
- IT operations technicians
Owing to the (relatively) small sample size of 147,000 this year and 140,000 in 2021, there is considerable fluctuation between the gender pay gaps of each SOC code group between years and so these findings should be considered with this in mind.
In April, WISE will be conducting a wider analysis of the gender pay gap data and reports from our WISE Member organisations. We will celebrate and share the successes of companies who have made good progress towards closing their own gender pay gaps.
The full data and report from ONS can be found at Data from: https://www.ons.gov.uk/employmentandlabourmarket/peopleinwork/earningsandworkinghours/bulletins/genderpaygapintheuk/2022.
Key points to note:
- Estimates vary in quality, mainly reflecting the size of the samples.
- Full-time defined as employees working more than 30 paid hours per week (or 25 or more for the teaching professions)
- ASHE covers employee jobs in the United Kingdom. It does not cover the self-employed, nor does it cover employees not paid during the reference period.
- GPG estimates are provided for the pay period that included a specified date in April. They relate to employees on adult rates of pay, whose earnings for the survey pay period were not affected by absence.
- ASHE is based on a 1% sample of jobs taken from HM Revenue and Customs’ Pay As You Earn (PAYE) records. Consequently, individuals with more than one job may appear in the sample more than once.